Choosing among the top 10 solar energy panels is not just a matter of comparing headline efficiency. Buyers must match a panel to their roof, climate, budget, and local installation options. A compact roof may reward higher output per square metre; a hot, sunlit roof makes temperature performance worth checking. Shade from a chimney can change the calculation. So can salt air near the coast. Small details matter.
Fatih Birol, executive director of the International Energy Agency, has called solar “the new king of electricity.” His observation reflects solar’s growing role, but it does not make every panel equally suitable. This guide compares leading options through practical measures: rated power, efficiency, product and performance warranties, temperature characteristics, and manufacturer support. Buyers should also check current datasheets and confirm that listed specifications apply to their market. Models and terms can change.
There is no perfect shortlist. A high-efficiency panel may cost more, while a lower-priced model could better fit a large, unshaded roof. Warranty length alone is not proof of long-term performance. Ask an installer to review roof condition, layout, and expected output before deciding. That extra check can feel tedious. It can also prevent an expensive mismatch. The comparisons ahead offer a starting point, not a substitute for site-specific advice.
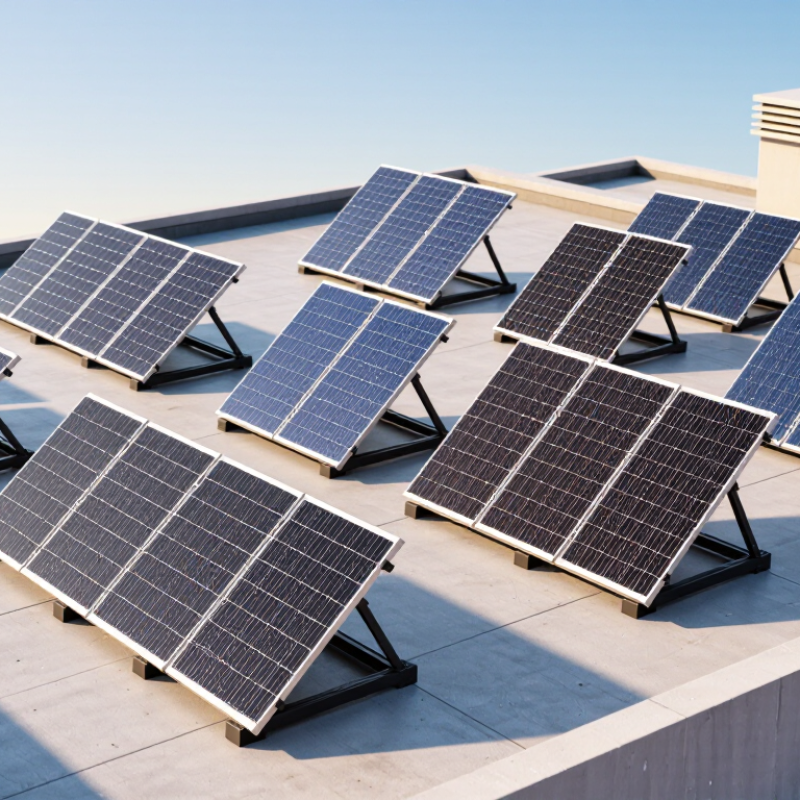
How Solar Panels Convert Sunlight into Electricity
Solar panels convert sunlight into electricity through the photovoltaic effect. Sunlight carries energy in tiny packets called photons. When photons strike semiconductor cells, they can free electrons from atoms. An electric field inside each cell guides these electrons, producing direct current, or DC. Wiring combines the output from many cells. The process is quiet. No moving parts. Yet sunlight does not guarantee steady power.
An inverter converts DC electricity into alternating current, or AC, which most household circuits use. A monitoring system can show how much energy the panels produce and how much the building uses. Output changes with cloud cover, panel angle, dust, shade, and temperature. Hot cells may produce less electricity than cooler ones. A branch casting shade across one section can also affect connected cells. Panel count alone does not tell the whole story; system design and site conditions matter.
Tips: Keep panels clear of avoidable shade and heavy dirt. Check performance readings over time, not just on one cloudy day. If output seems unexpectedly low, have a qualified installer inspect the system. Even careful estimates can miss local shading.
Solar cells convert sunlight into direct-current electricity. This chart shows estimated output at different sunlight levels for a 1 m² panel with 20% conversion efficiency.
Estimate based on: electrical output per square metre = sunlight irradiance × panel efficiency. Values assume steady conditions and do not account for temperature, shading, or system losses.
When comparing solar panels, start with the conditions at the installation site, not the highest efficiency figure. A compact roof may benefit from higher output per square metre, while a spacious, sunny site may make price per watt more important. Check the temperature coefficient, too: panels can lose output in strong heat. Small differences matter over years.
Look beyond the headline warranty. Compare the stated annual degradation rate, product coverage, and the test conditions behind performance claims. Ask for independent certification and verify that panel dimensions and electrical ratings match the planned inverter. Compatibility is easy to overlook. For international purchases, factor in freight, packaging, local service access, and replacement-part availability. A low purchase price can become less attractive after a long shipping delay.
Real operating data helps, but it may not match your location or roof angle. Treat projections as estimates, not promises. I would also ask sellers for clear documentation before paying; some specification sheets leave practical questions unanswered. That is worth pausing over. Choose the panel that fits the site, budget, and support needs—not merely the one with the most impressive brochure.
Indicative comparison of common commercial panel technologies. Efficiency, power, degradation, and warranty figures vary by product, size, test conditions, and market; verify the datasheet and warranty terms for each specific module.
| Panel technology | Typical module efficiency | Typical module output | Temperature coefficient* | Typical annual power degradation | Common warranty range** | Key strengths | Points to compare |
|---|---|---|---|---|---|---|---|
| Monocrystalline TOPCon | About 21–23% | About 430–650 W | About −0.29 to −0.32%/°C | Often about 0.3–0.5% per year after year one | Often 12–25 years product; 25–30 years performance | High efficiency and broad availability; increasingly common for residential and utility projects. | Compare independently tested output, degradation terms, and module dimensions. |
| Monocrystalline HJT | About 21–23.5% | About 400–650 W, depending on format | Often about −0.24 to −0.30%/°C | Often about 0.25–0.4% per year after year one | Often 15–25 years product; 25–30 years performance | Strong temperature performance and good potential for high-efficiency applications. | Check price premium, availability, and product-specific temperature data. |
| Monocrystalline IBC | About 22–24% | About 400–500 W, depending on format | Often about −0.29 to −0.35%/°C | Often about 0.25–0.5% per year after year one | Often 25 years product; 25–30 years performance | High module efficiency and a clean front appearance, useful where roof area is limited. | Compare installed cost per watt and the exact warranty exclusions. |
| Monocrystalline PERC | About 19–22% | About 350–600 W, depending on format | Often about −0.34 to −0.40%/°C | Often about 0.4–0.6% per year after year one | Often 10–15 years product; 25 years performance | Established technology with broad installer familiarity and a wide range of module formats. | Compare carefully with newer cell designs on price, efficiency, and remaining availability. |
| Bifacial TOPCon, dual-glass | About 21–23% front-side efficiency | About 430–650 W front-side rating | Often about −0.29 to −0.32%/°C | Often about 0.3–0.5% per year after year one | Often 12–25 years product; 25–30 years performance | Can produce additional energy from rear-side light when installed over reflective surfaces or with suitable spacing. | Rear-side gain is site-dependent; compare bifaciality, mounting design, and module weight. |
| Bifacial HJT, dual-glass | About 21–23.5% front-side efficiency | About 400–650 W front-side rating | Often about −0.24 to −0.30%/°C | Often about 0.25–0.4% per year after year one | Often 15–25 years product; 25–30 years performance | Combines rear-side generation potential with relatively strong performance in hot conditions. | Model rear-side output conservatively and confirm structural-load requirements. |
| Shingled monocrystalline silicon | About 20–22.5% | About 350–500 W, depending on format | Typically similar to the underlying silicon cell design; check datasheet | Often about 0.3–0.5% per year after year one | Often 12–25 years product; 25–30 years performance | Cell-strip layout can improve shade tolerance in some designs and reduce visible gaps. | Shade response depends on electrical layout; compare bypass-diode configuration and serviceability. |
| Cadmium telluride thin film (CdTe) | About 17–19% | Varies substantially by module size and design | Often about −0.25 to −0.32%/°C | Product-specific; check the warranted degradation schedule | Often 10–25 years product; performance terms vary by product | Thin-film technology can perform well in hot conditions and diffuse light, depending on the product and site. | Check local permitting, recycling, supply, and lifecycle requirements for cadmium-containing modules. |
| Copper indium gallium selenide thin film (CIGS) | About 15–19% | Highly format-dependent; compare by area and rated output | Product-specific; confirm the datasheet | Product-specific; check the warranted degradation schedule | Varies by product and supplier | Can be manufactured in lightweight or flexible formats for certain building and specialty applications. | Compare certification, long-term supplier support, installation method, and output per area. |
| Polycrystalline silicon | About 15–18% for common legacy modules | Often about 250–400 W, depending on age and format | Often about −0.38 to −0.45%/°C | Often about 0.5–0.7% per year; verify module-specific terms | Commonly 10–12 years product; performance warranty varies | Mature technology that may suit replacement or price-led projects where compatible stock is available. | Often less efficient than current mainstream options; check age, condition, certification, and spare availability. |
* Temperature coefficient indicates the approximate change in power for each degree Celsius above the module’s standard test temperature; a value closer to zero generally means less heat-related power loss. ** Warranty periods are common market ranges, not guarantees for every product. Bifacial output depends on rear-side light and installation conditions and should not be added to the front-side nameplate rating without a site-specific assessment.
Solar buyers rarely need the same panel. A sunny farm, a shaded city roof, and a remote cabin face different limits. A useful top-ten comparison should weigh output, space, weather, and installation costs, not just headline efficiency. Rankings can look neat on paper. Real roofs are less tidy.
High-efficiency monocrystalline panels suit small roofs where every square metre matters. Budget-focused projects may accept lower output per panel to reduce upfront costs. Thin-film panels can be lighter for certain large or curved surfaces, while bifacial designs may gain energy from reflected light beneath them. Half-cut cell panels can reduce some power losses. TOPCon and heterojunction designs may offer strong performance, but buyers should compare tested specifications and warranties. For hot regions, check temperature-related output loss. For snowy or windy sites, confirm the mounting system is appropriate. Details matter.
The remaining choices depend on the job: flexible panels for weight-sensitive setups, glass-glass panels for added durability, and compact modules for small installations. Some buyers may prefer panels with readily available replacement options. Others may prioritize recyclability or a long product warranty. These categories overlap, and technology names alone cannot predict real-world output. Ask installers to estimate annual generation using local weather, roof direction, and shading. A panel that looks ideal in a catalogue may disappoint under a chimney’s afternoon shadow.
A panel that performs well in a cool, dry climate may lose output on a hot rooftop. Compare its temperature coefficient and operating-temperature range, not only its rated wattage. A lower temperature coefficient can help limit heat-related losses, though installation airflow matters too. Small details matter. In humid or coastal locations, check whether the module has relevant salt-mist and damp-heat qualification. For dusty sites, consider cleaning access and water availability; a high-efficiency panel cannot compensate for persistent soiling. Snow and wind loads also need to match the site’s design conditions.
Local standards shape the shortlist. IEC 61215 addresses module design qualification, while IEC 61730 covers safety; buyers should also verify local certification and grid-connection requirements. The IEA PVPS report Trends in Photovoltaic Applications 2024 estimates that global cumulative solar capacity exceeded 1.6 terawatts by the end of 2023. That rapid expansion makes careful product comparison more important, not less. Use site-specific irradiance and temperature data, such as those available through the World Bank’s Global Solar Atlas, rather than relying on a country-wide average. One caution: simulations are only as good as their inputs. Shade from a nearby tree can make a tidy model look overly optimistic.
For global buyers, the lowest price per watt is only a starting point. Compare the full delivered cost, including shipping, mounting hardware, installation, and likely replacement expenses. A panel that costs more upfront may produce more electricity in a limited roof area. Check its rated output and temperature coefficient, especially if it will operate in a hot climate. Small figures matter.
Warranty terms need close reading. Product warranties generally cover manufacturing defects, while performance warranties promise a minimum output over time. These are different protections. Check the coverage period, the claimed annual degradation rate, and what evidence is required for a claim. Also ask whether labor, transport, and removal are included. A long warranty can look reassuring on paper, but exclusions may leave the owner paying for repairs.
Long-term performance depends on more than the panel itself. Dust, shade, high temperatures, and poor installation can reduce real-world output. Compare independent test data where available, and consider whether local installers can support the system years later. This comparison is imperfect: test conditions rarely match every roof or climate. Still, reviewing realistic energy estimates alongside warranty terms gives buyers a clearer view of lifetime value than headline efficiency alone.