What Are the Best Commercial Solar Panels for Businesses?
Choosing the best commercial solar panels for a business is not simply a matter of selecting the highest wattage. Roof size, electricity demand, local weather, financing terms, and maintenance access can change the decision. A warehouse in Arizona may prioritize heat tolerance and high energy yield. A coastal office may need stronger corrosion resistance. The most expensive panel is not always the most suitable one.
Fatih Birol, Executive Director of the International Energy Agency, described solar power as “the new king of electricity.” That statement reflects solar’s growing commercial importance, but it does not remove the need for careful evaluation. Businesses should compare efficiency, temperature coefficients, degradation rates, warranties, fire ratings, and manufacturer stability. Installation quality matters too. A powerful panel can underperform when shaded by rooftop equipment or installed with poor ventilation. Small details matter.
This guide examines leading commercial solar options through a practical business lens. It considers long-term output, usable roof space, operating costs, and expected return on investment. It also looks beyond attractive efficiency figures. Marketing claims can sound impressive. Real project results may differ. That uncomfortable gap deserves attention.
Some companies need maximum production from limited roof area. Others need dependable panels at a lower initial cost. There is no universal winner. The right choice should support a company’s energy goals, budget, and risk tolerance. Careful analysis beats a rushed purchase.
Define Commercial Energy Demand with NREL PVWatts and Utility-Tariff Data
The best commercial solar panels begin with a clear energy-demand profile, not a glossy efficiency rating. NREL’s PVWatts tool can estimate hourly production from system size, roof tilt, azimuth, weather, and losses. Model a 200-kilowatt rooftop system, then compare its output with fifteen-minute utility interval data. A factory may produce power at noon, yet face its highest demand at 6 p.m. That mismatch matters.
Utility-tariff data defines the real financial value. Check energy prices, demand charges, fixed fees, export credits, and seasonal rules. The U.S. Energy Information Administration reported that commercial electricity prices averaged about 13 cents per kilowatt-hour in 2023, but local tariffs vary widely. NREL’s commercial PV research also shows that system orientation and load timing can influence value as much as panel efficiency. Higher-efficiency modules may help on a crowded roof. They are not always the lowest-cost choice. A perfect model is still imperfect.
Tips: Import at least twelve months of interval bills into the analysis. Mark weekends, shutdowns, and unusually hot days. Test three scenarios: low production, expected production, and high production. Compare annual savings with peak-demand reduction. Also inspect roof age, access paths, inverter replacement timing, and shading after 3 p.m. Many proposals miss these details. I would review the tariff with a qualified energy professional, because one overlooked demand rule can change the preferred system size.
What Are the Best Commercial Solar Panels for Businesses?
Commercial solar selection should begin with site-specific energy demand, local solar resource, and the utility tariff. This chart compares monthly electricity demand with PVWatts-style modeled output for a 500 kW rooftop photovoltaic system in a high-solar U.S. location.
Planning assumptions: 500 kWdc rooftop PV system, approximately 1,000 MWh of annual solar production, and a commercial facility using approximately 1,800 MWh annually. Actual results vary with location, weather, system losses, operating schedules, demand charges, and utility tariff rules. Methodology aligned with NREL PVWatts-style monthly production modeling.
Evaluate Heat Performance Using Temperature Coefficients and Climate Data
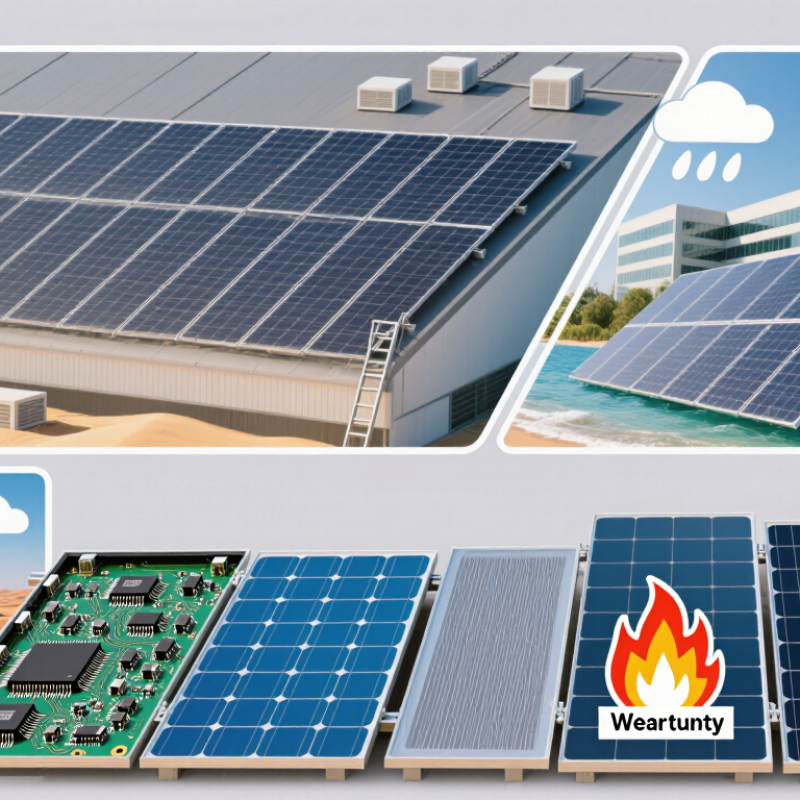
Choosing commercial solar panels requires more than comparing rated watts. Heat performance matters because module output usually falls as cell temperature rises. Most crystalline-silicon modules lose about 0.3% to 0.5% of power for every degree Celsius above 25°C. The National Renewable Energy Laboratory’s PVWatts documentation uses module temperature models to estimate this effect. A rooftop reaching 65°C can therefore reduce instantaneous power by roughly 12% to 20%, before shading or soiling.
Temperature coefficients deserve close attention. A coefficient of -0.29%/°C generally performs better in hot conditions than -0.40%/°C. However, the coefficient alone is not enough. NOAA 1991–2020 climate normals can reveal local summer temperatures, while on-site roof measurements show wind exposure and mounting effects. Ventilated, elevated arrays often run cooler than systems installed close to dark roofing. That difference can be visible at noon, when demand may also peak.
I initially treated the lowest temperature coefficient as the obvious choice. That was too simple. Low-irradiance behavior, mechanical design, inverter limits, and measured annual yield also affect business value. The IEA PVPS Task 13 reports stress the importance of field data and consistent performance measurements.
Ask suppliers for IEC-tested temperature coefficients, NOCT or NMOT values, and simulations using local hourly weather data. A model using average temperatures may look precise, yet still miss a windless heatwave.av电影
Check 0.3–0.5% Annual Degradation, IEC Tests, and 25–30-Year Warranties
Choosing commercial solar panels starts with their performance years after installation, not only their day-one wattage. Annual degradation matters because a large rooftop may operate for decades. Look for a stated rate between 0.3% and 0.5% per year. A 0.4% rate preserves more energy over 25 years than a 0.5% rate. Check whether the calculation includes first-year degradation separately. Many datasheets use different methods, which makes comparisons imperfect.
IEC testing provides a useful technical baseline. Confirm certification for IEC 61215 and IEC 61730, including the exact panel construction being offered. These standards examine durability, electrical safety, temperature changes, humidity, and mechanical loads. They do not guarantee zero failures. That distinction is important. Ask for current certificates, laboratory details, and test conditions. A roof near the coast, for example, may need closer attention to salt exposure and corrosion resistance.
Review both the product warranty and the performance warranty. A 25–30-year performance warranty should explain the allowed degradation each year. It should also identify repair, replacement, shipping, and labor responsibilities. Some warranty terms appear strong but exclude difficult rooftop access or installation defects. Read the exclusions carefully. A useful practice is matching warranty language with the installer’s contract. This step is often skipped. That can become expensive. Keep the final datasheet, serial records, inspection reports, and commissioning results. Even careful buyers can overlook small wording differences.
What Are the Best Commercial Solar Panels for Businesses? — Check 0.3–0.5% Annual Degradation, IEC Tests, and 25–30-Year Warranties
Rank Total Cost with LCOE, Demand Charges, and the U.S. 30% ITC Benchmark
The best commercial solar panels are not always the ones with the highest wattage. A reliable ranking starts with levelized cost of energy, or LCOE. LCOE spreads equipment, installation, financing, maintenance, degradation, and replacement costs across expected lifetime production. I would compare panels using a site-specific production model, not a brochure rating. A roof with partial shade can erase the advantage of a slightly more efficient panel. Tiny losses matter.
Demand charges can change the ranking completely. Many utilities bill businesses for their highest fifteen-minute power draw each month. Solar may reduce daytime consumption, but it may not lower the peak enough. Review at least twelve months of interval data before selecting equipment. A facility with heavy afternoon cooling loads may gain more value than a facility with steady overnight usage. Storage could help, but its controls, cycling limits, and replacement cost must enter the LCOE calculation.
Use the U.S. 30% Investment Tax Credit as a benchmark, not a guaranteed outcome. Eligibility, construction timing, labor requirements, and project structure can affect the final benefit. A careful financial model should show results with and without that incentive. My early comparisons focused too heavily on panel price. That was incomplete. The stronger method ranks total annual savings, demand-charge reduction, degradation assumptions, warranty support, and installation risk together. Ask for production guarantees and transparent assumptions. Then test the model against a cloudy year. Reality will not follow the spreadsheet perfectly.